Climate Change
Objective:
Students will be able to explain the local implications of rising sea levels and provide a novel solution for conditions in the future
NGSS Standards:
MS-ESS3-5. Ask questions to clarify evidence of the factors that have caused the rise in global temperatures over the past century.
Overview of Lesson:

At the end of a long year, this was our final multi-subject project for the 6th grade students. The goal was to educate the students about how climate change and rising sea levels would affect Ventura County by looking at the potential social, economic, and environmental changes in our region. My team of three 6th grade teachers divided all of our students into groups of 4 or 5 and gave ourselves the target of having projects ready to complete by open house.
In splitting up the content, the math teacher took the economic factors into consideration and had the students calculate how much wealth would be lost if the properties were underwater. This process involved using blown up maps of the region and calculating the total Zillow value of the houses on each street. Students used spreadsheets to keep track of the data and one group was assigned to collect and analyze all the data from all groups. The language arts/history teacher went over the societal impacts of climate change and read articles of how communities around the world are dealing with these changes.
Because the NGSS standard clearly expects students to consider the implications of climate change, I tied everything together by presenting information about climate change and the effects on the Earth. Part of the activity was to map out what areas of land would be underwater as the sea level rose. This involved going back to the former state standards and doing a few lessons on interpreting topo maps so that students could visualize the sea level at various elevations. Each group had a map that they colored in to their assigned sea level, all the way up to the anticipated level if all ice melted at 220 feet. This project was also a bit of a puzzle because the students had to assemble the large topo maps from the 8 1/2″ x 11″ sheets of the photocopied maps.
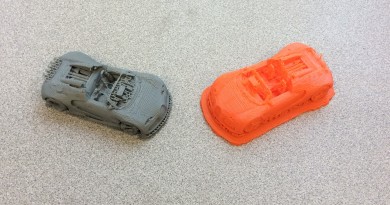
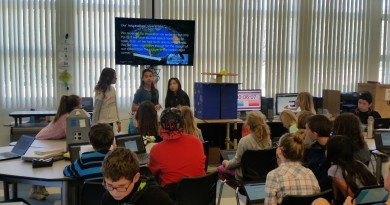
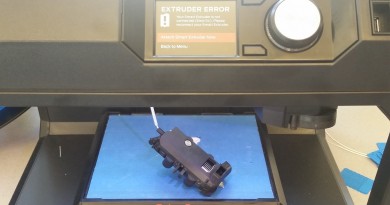
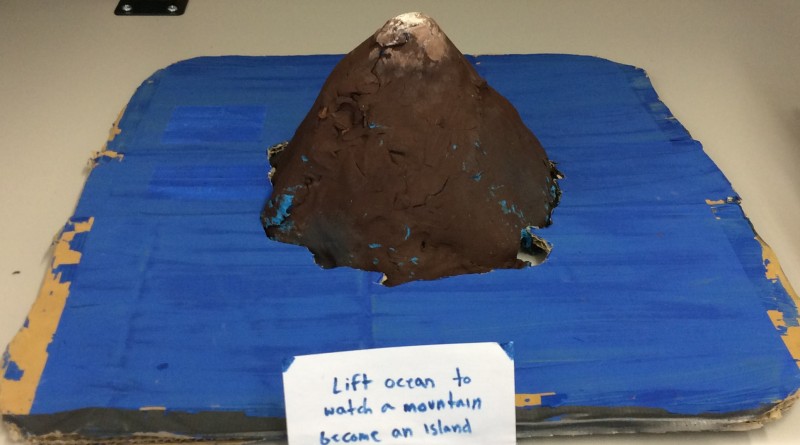
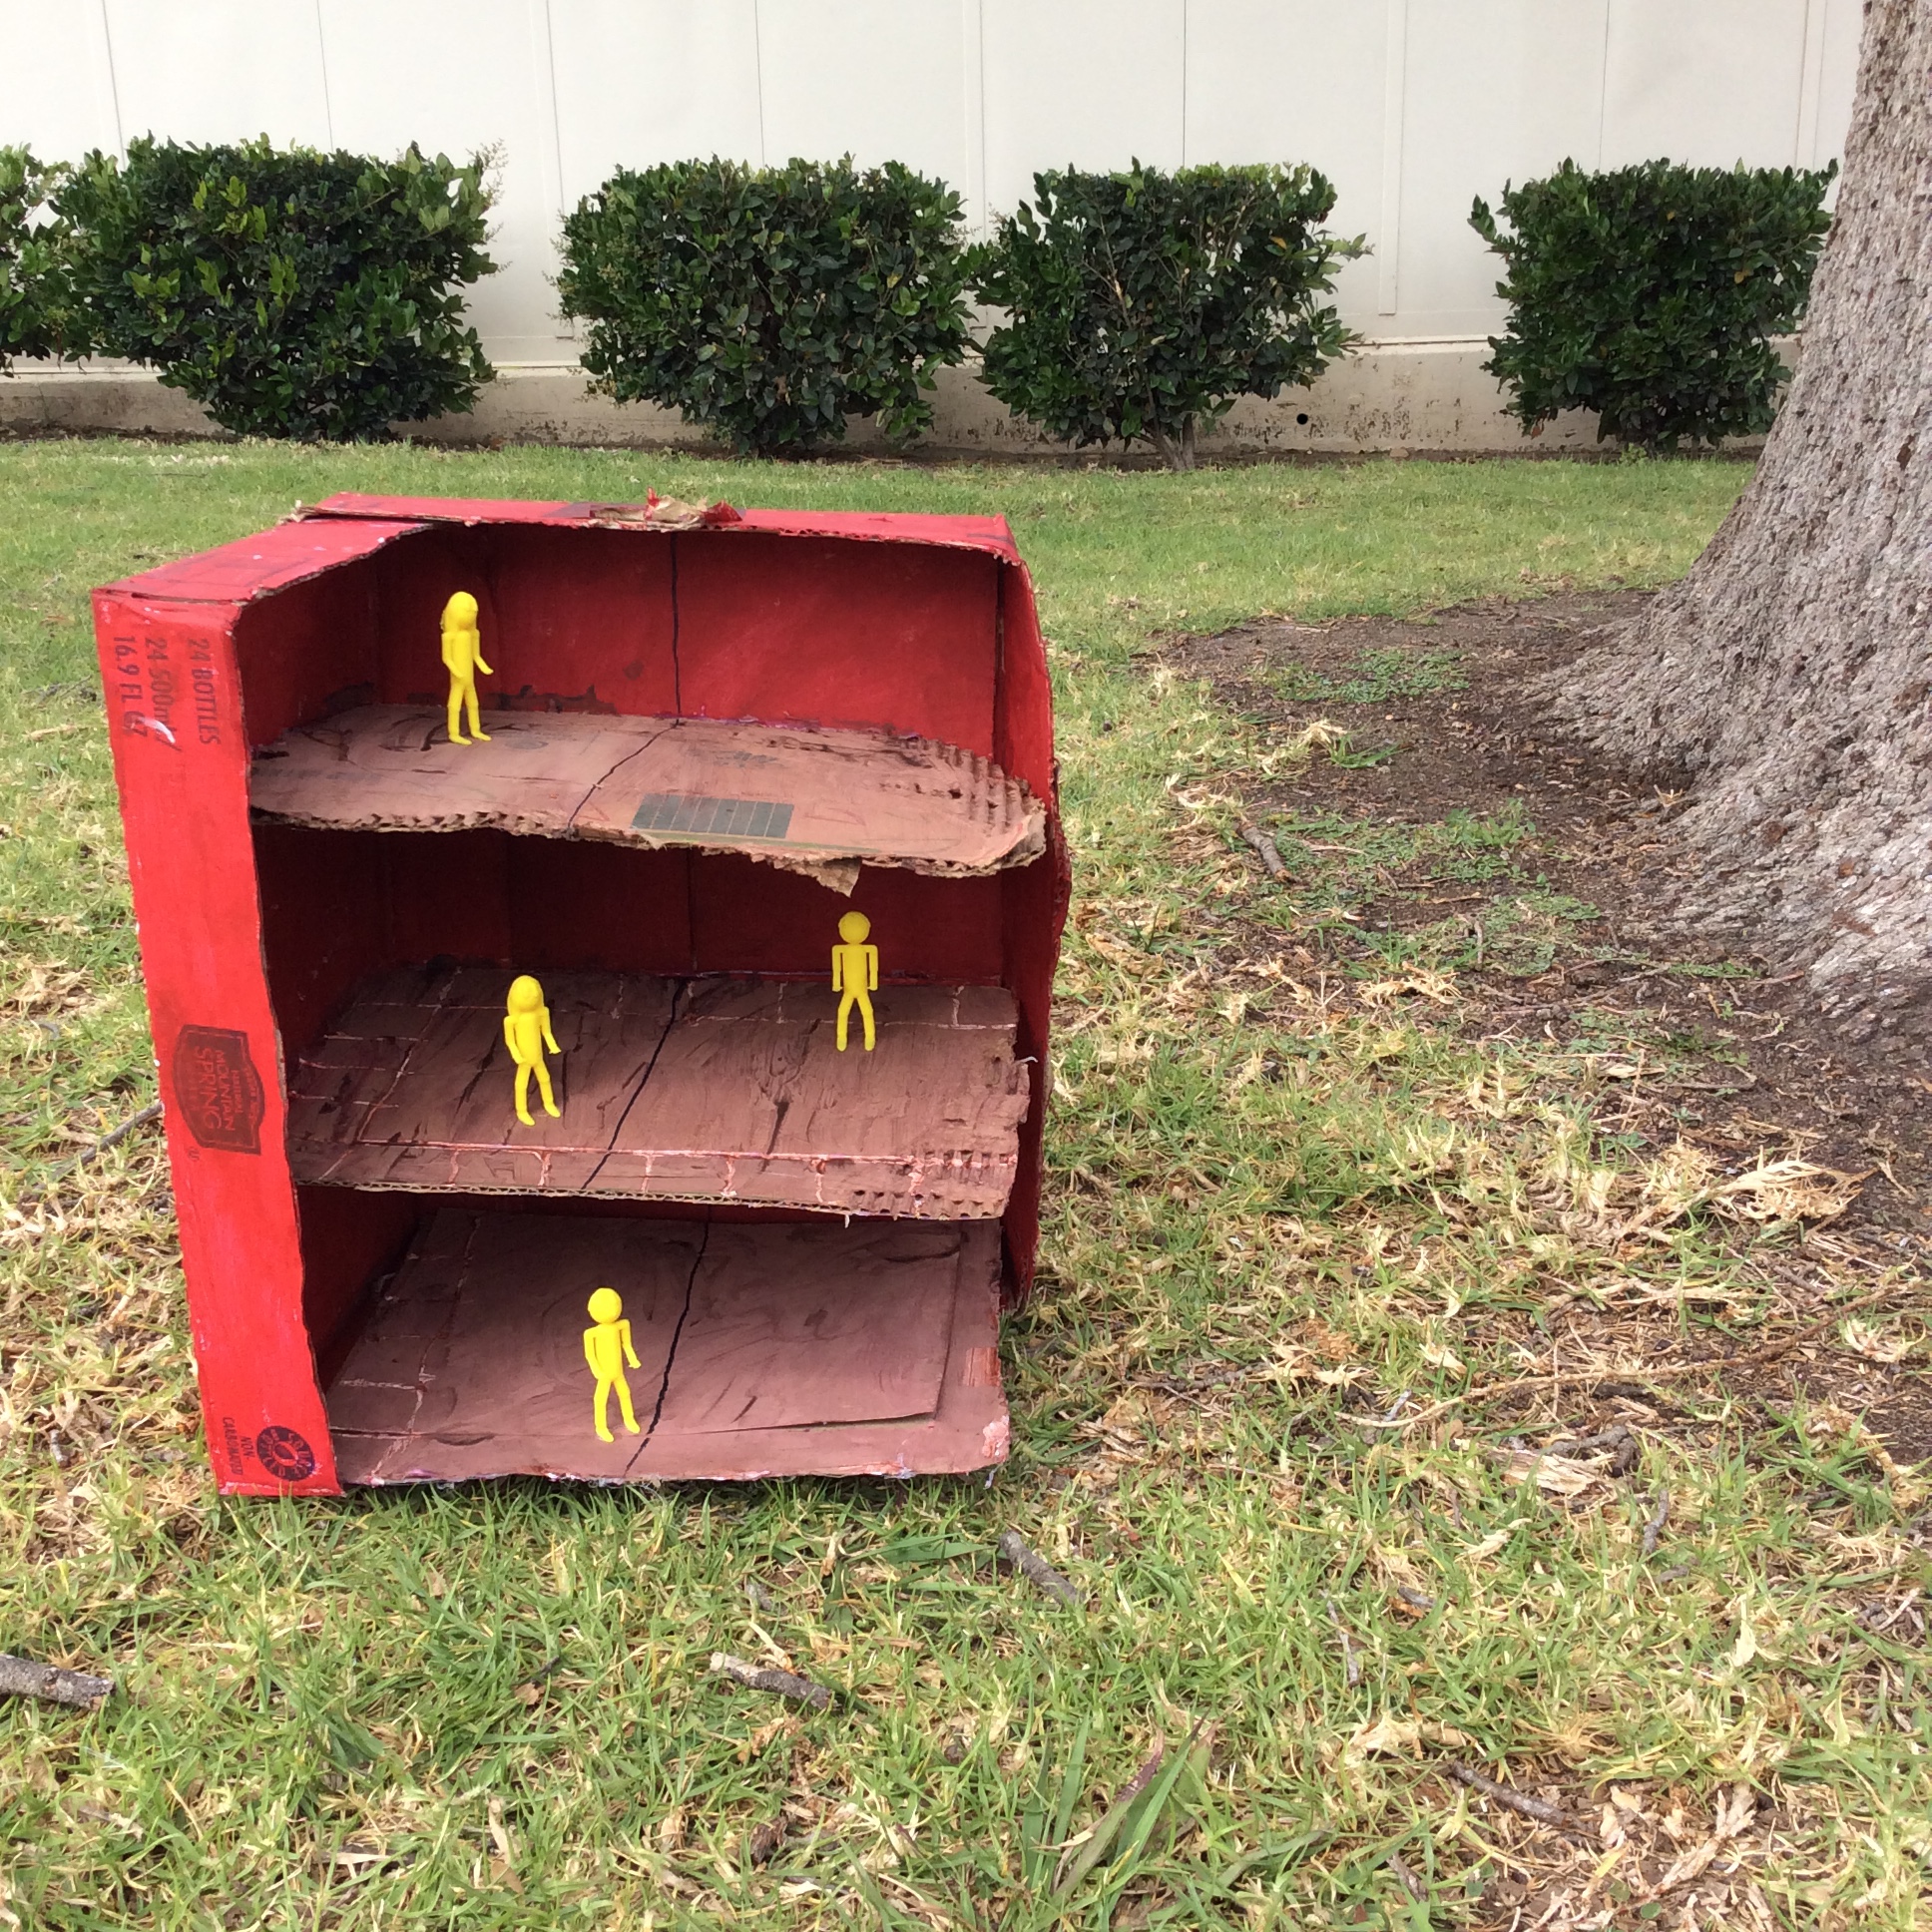
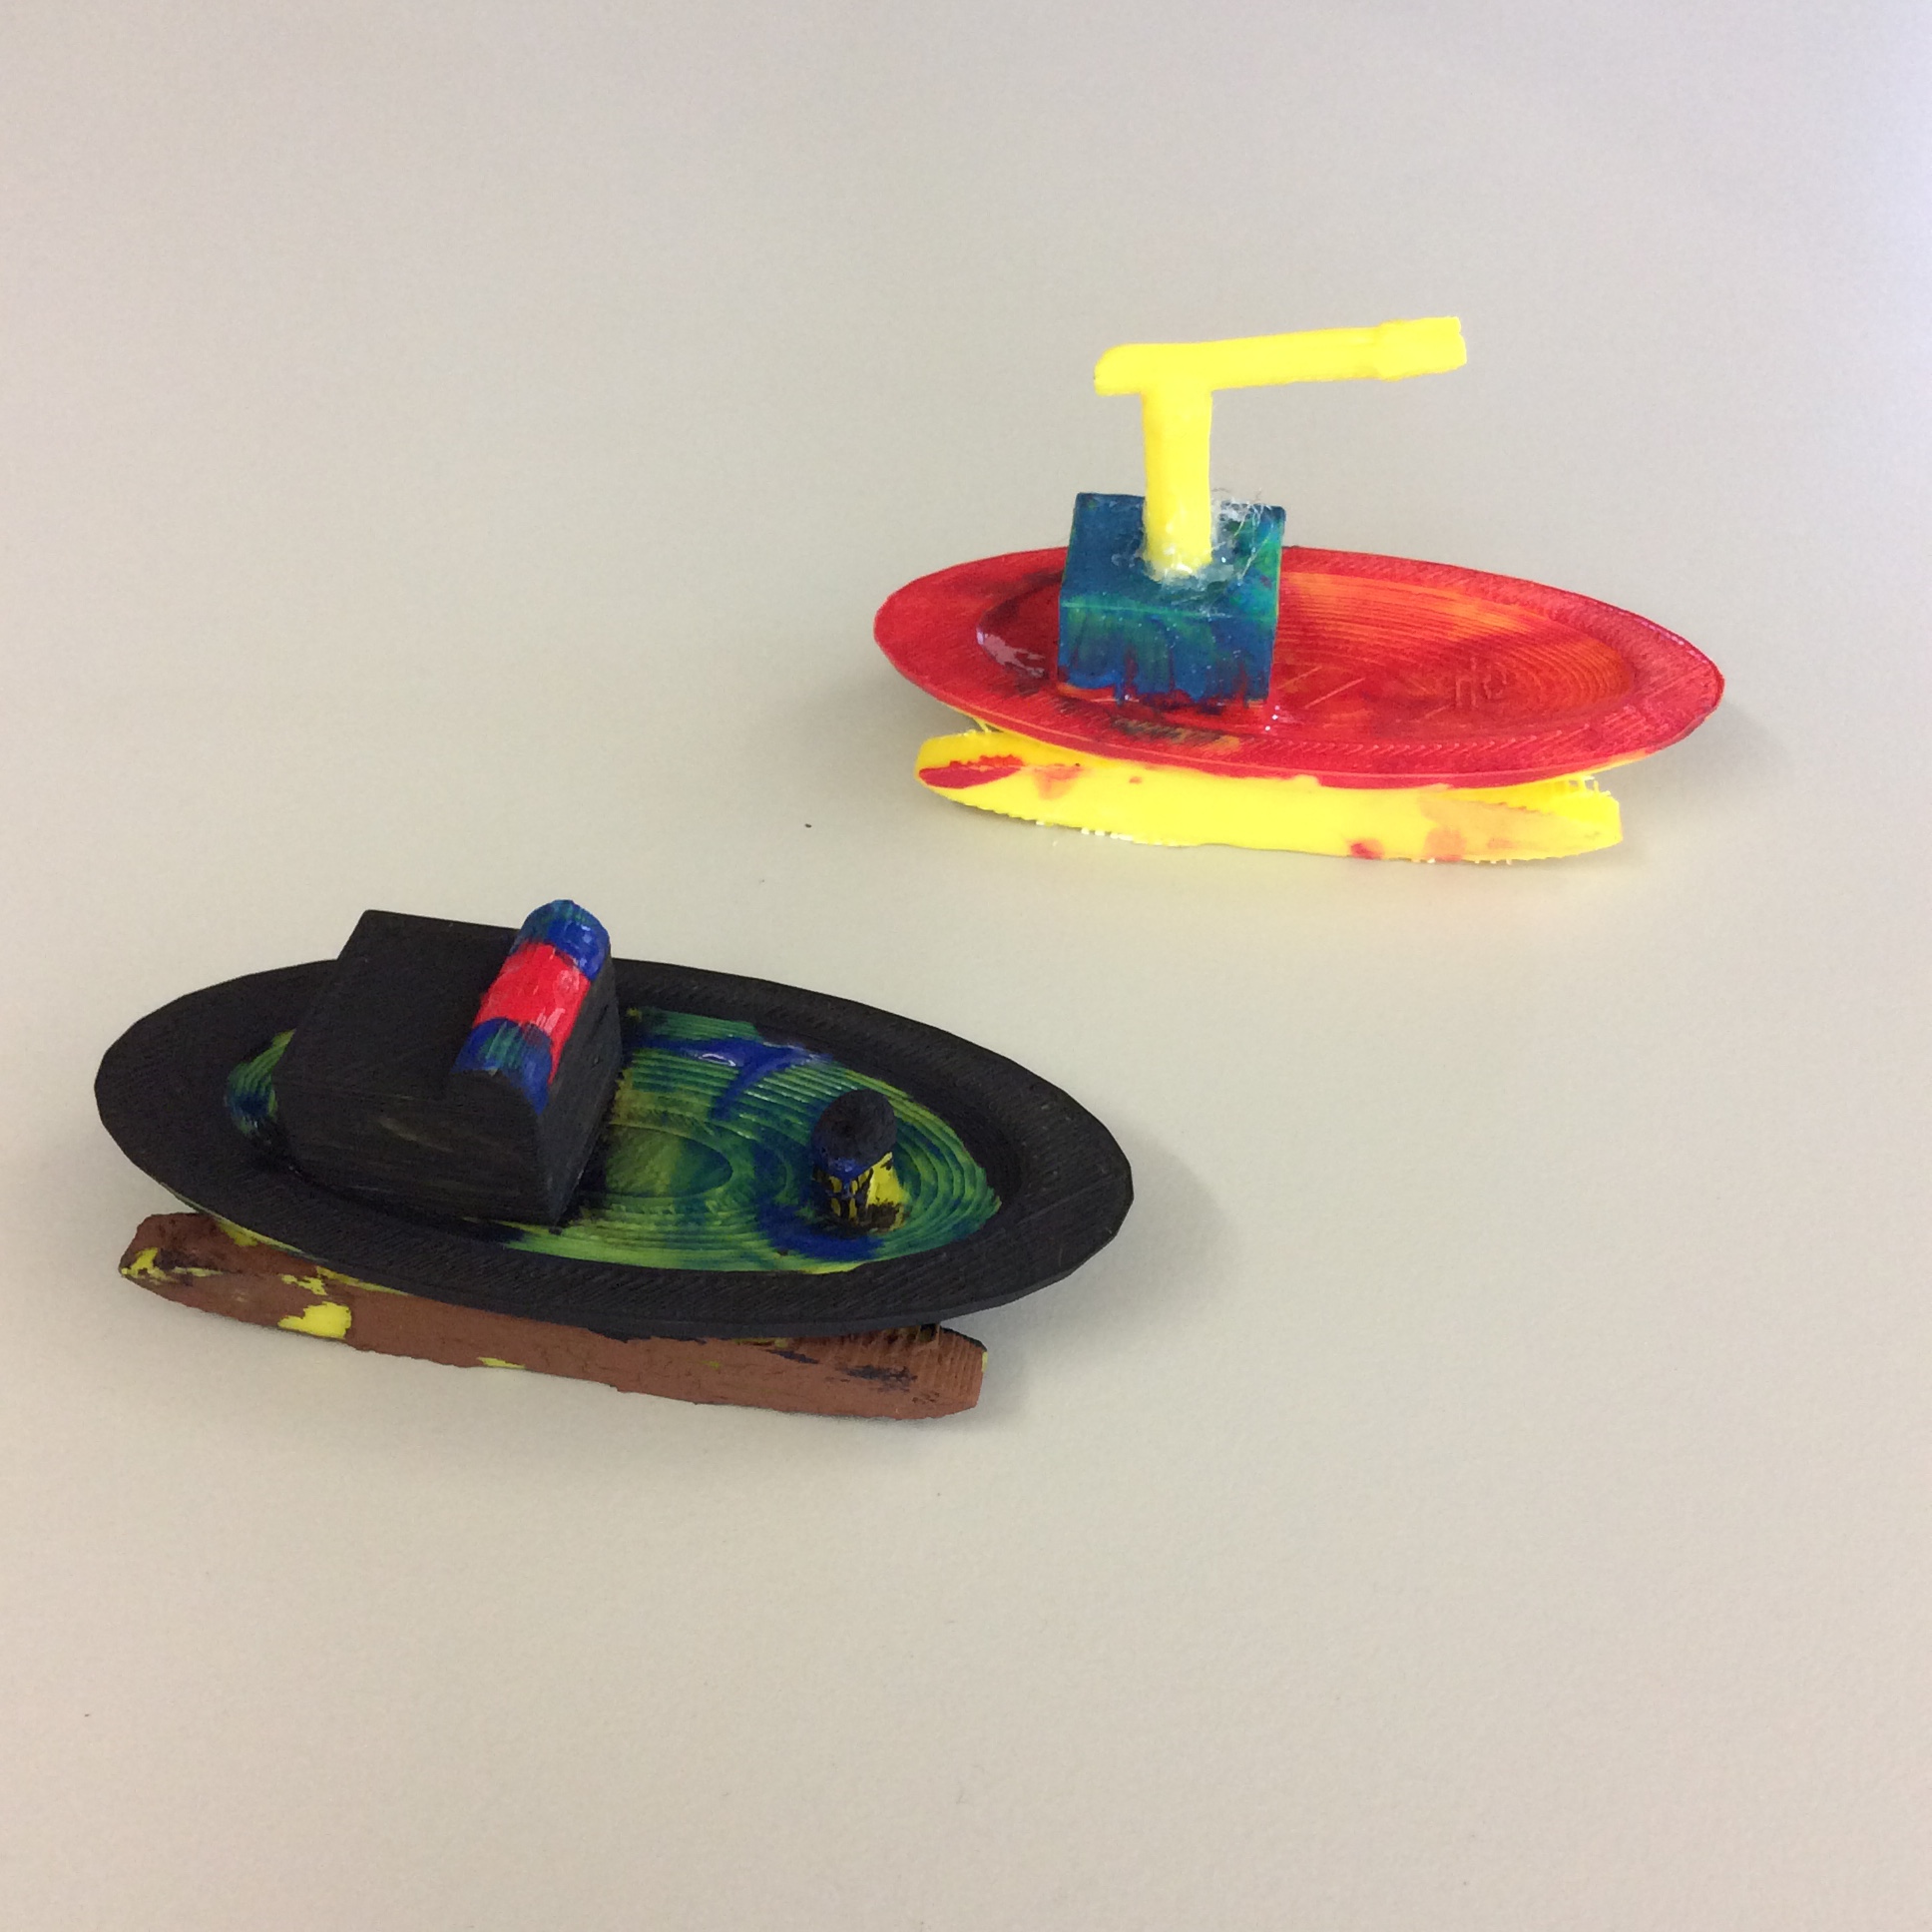
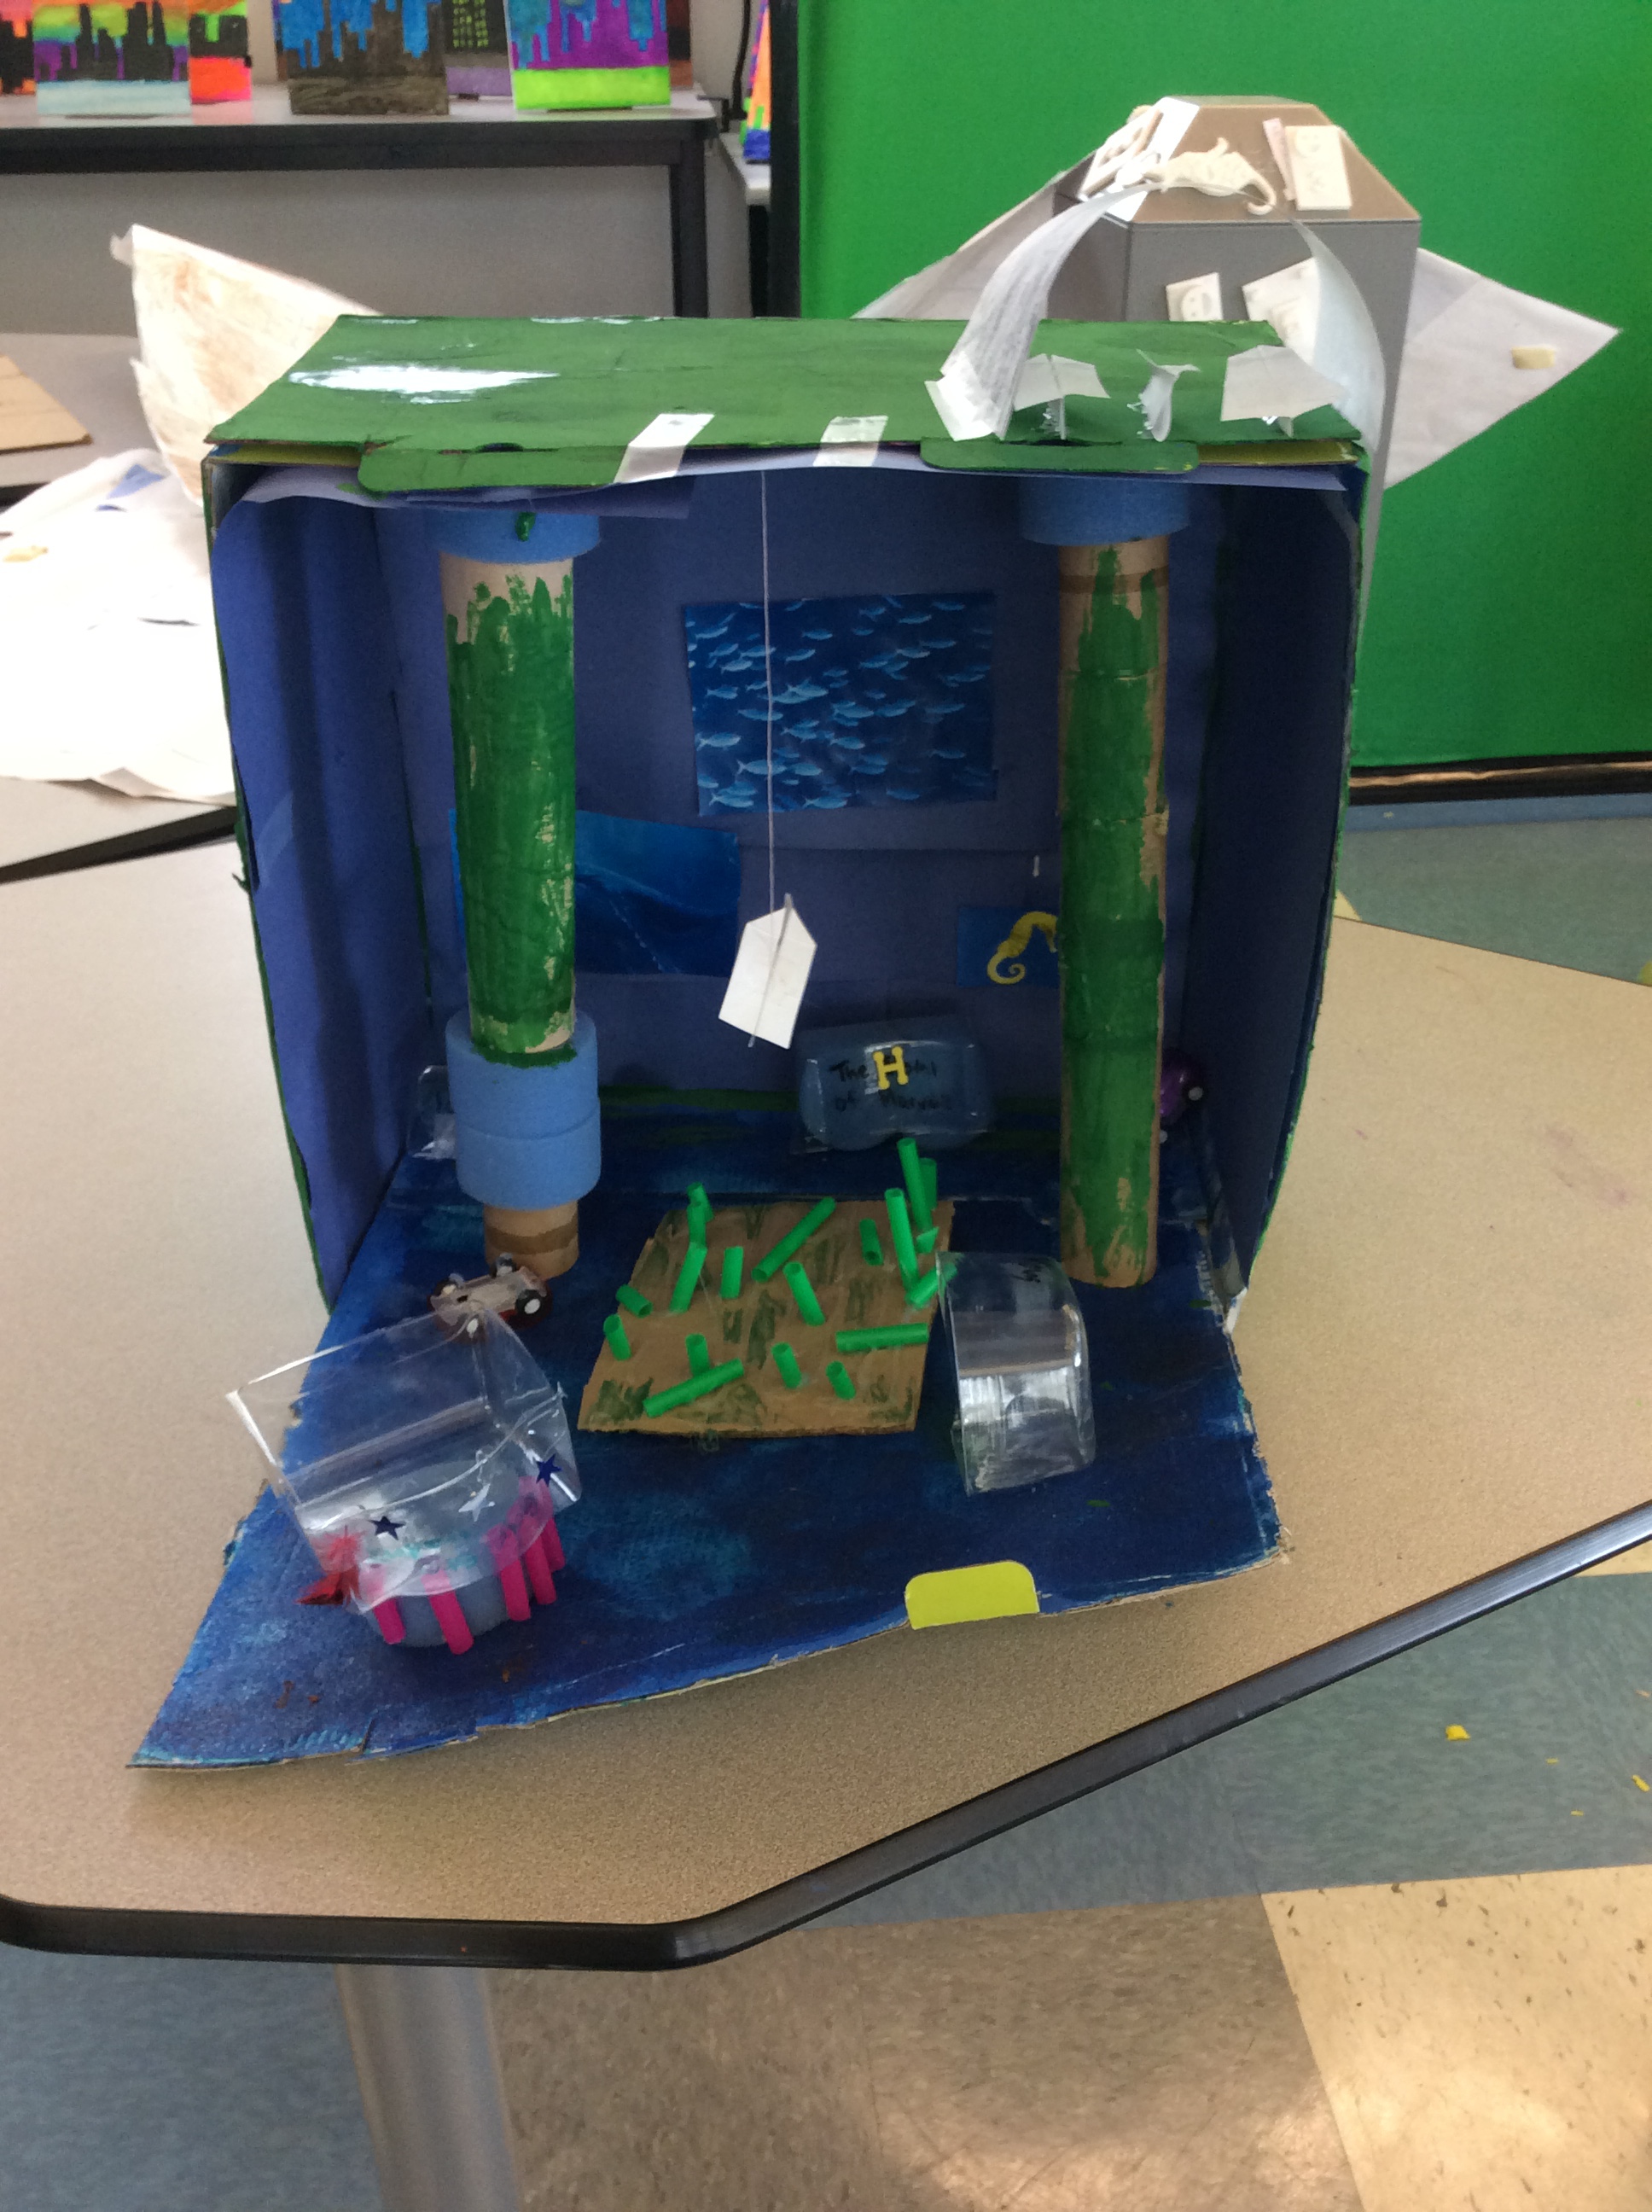
The real meat of the project was what I called the Climate Change Thing. Each group was assigned an aspect of our local society that would be affected by rising sea levels and were assigned to create a solution to that problem. To explain their solution, they could make any sort of thing that they wanted, be it a model, website, video, etc. My hope was that students would consider the various tools they had used over the course of the whole year and choose a creative one to present their information. The majority of the groups made presentations which saddened me a bit but which seems to have been the format that students were most comfortable using.
To assemble all components of this project, students had roughly one month before the projects were displayed at open house. At the end of the project, students completed reflection surveys to reflect upon their group’s work and to provide feedback to me.
Areas that students needed help on:
Logistics became the most difficult part of this project. Because students travel to different classes, the entire group was rarely able to work together on the project as a whole. This was a boon when assembling the maps because it quickly became clear that the groups with 3 or more people were much more dysfunctional at assembling the paper puzzle than when groups of two worked on it. However, the students had difficulty effectively communicating their creative ideas to their group mates in the other classes. This led to some students monopolizing the project and others having no idea or not agreeing with the final designs. I set up project management websites for students to use as a communication channel, but they were only as useful as the students let them be. I did my best to intermediate and to check on the progress of each group but many of the groups quickly dove in one direction which may not have been the direction I was hoping for. By the end, the time crunch and the divided work between the two classes led to projects being patched together rather than refined.
Assessment/Scoring:
Students self-reflected on their group climate change project using a Google Form rubric: goo.gl/s91cb6 I assessed students using this same Google Form rubric as well.
Student self-scoring was significantly different from my scoring of the student work. During the next class, students completed a follow-up survey which compared their scores with my scores to consider the differences: goo.gl/c3VjcQ
Student’s final scores on the project were influenced based on the depth of explanation about any scoring discrepancies on this second survey.
Student samples:
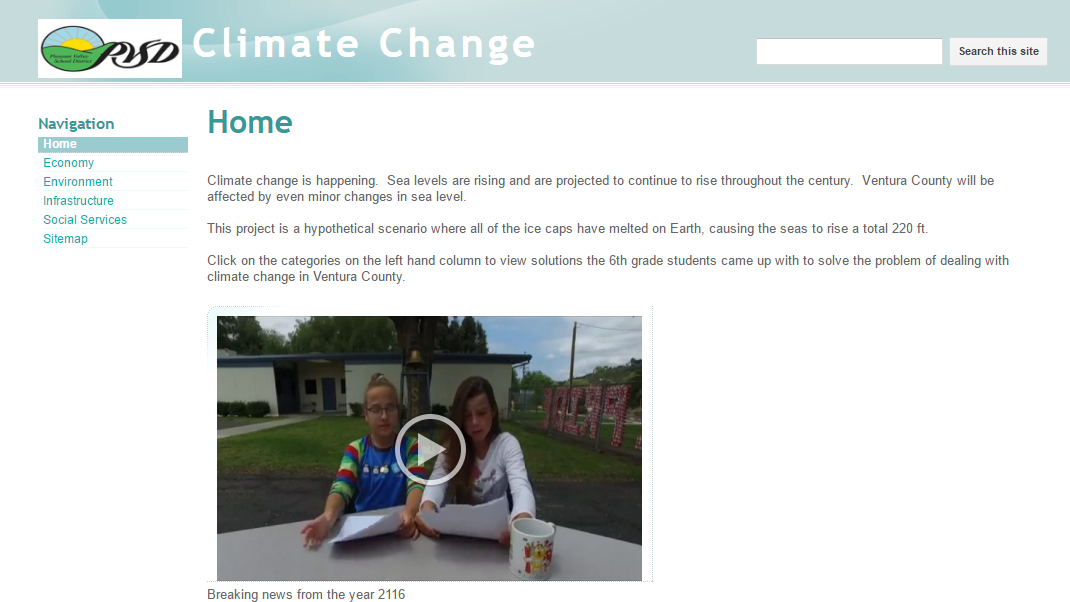
All student work was collected into a website that was on display at open house and was shared with parents: Climate Change
Conclusions/Reflections for the Future:
Would I do this same project the same way again? No. Yes, I absolutely intend to keep teaching about climate change and encouraging students to collect data to come to their own conclusions about the causes of it. I am just not happy with the way this was executed. Working on a whole grade level project is a useful expansion of PBL so that students can see how one theme really is interconnected in their different classes. To do this though, the effort and time needs to be balanced so that students don’t feel too overwhelmed with one class’ work at the detriment of others. Also, the projection to 220 ft sea level rise is useful to shock students into being aware of the potential of the problem, but is a little disingenuous in terms of the time scale for this to happen. I’d almost like to focus more on how we can prevent this from happening rather than solely focusing on what we’ll do once it happens.
The other major concern was how the students reacted to this assignment. The output they produced was no where near the level I had seen earlier in the year or expected from them. When I graded their work, my scoring was significantly below how they graded themselves, showing quite a bit of disconnect between their perception and mine. To illustrate this for the students, I created a feedback document for each student with the scoring comparisons in detail: goo.gl/qKI3ME. For the first time I also made feedback videos for the students using the SnagIt extension where I explained my reasoning. I’ve heard the benefits of using speech feedback such as Kaizena but didn’t like how everyone had to have the app in order to use it. These videos were reasonably quick to make and allowed me to be candid in my feedback to them. Sample feedback to a group with significant problems: goo.gl/Rp9g2T and minor problems: goo.gl/4iCTXL. After reviewing their feedback, students were able to give me feedback again and to explain whether they thought their own self scoring or my scoring was more accurate. Sample student feedback from second survey: goo.gl/sq63e4 Many students saw that they had “sugarcoated” the grades to give themselves positive scores while I was more honest in the scoring. A handful of students thought my score was better just because I was the teacher and knew more than them.
From this whole entire project, I learned that I really need to start giving students the opportunity to self assess earlier in the year. The discussions we had on this final project should have been happening in November so that they could grow from the discussions over the course of the year. I also need to consider what changes I can make to my practice in order to reduce the apparent confusion over the expectations.
Digital Resources:
Climate Change Thing Instruction Sheet
LEC Data Literacy Lesson Plan for Climate Change